HORSE RACING RATINGS EXPLAINED
RACEXPERT ONLINE IN DETAIL

RACECARDS
No. OLIVERS
MOUNT wears the number 8 saddlecloth.
Drw OLIVERS MOUNT
is drawn to run from starting stall 10. Starting stalls are not
used for National Hunt (jumps) racing.
Form The horse's
last four race finishing positions.
Horse The horse's
racing name.
BF If a horse was
a Beaten Favourite last time out it will be flagged in RED next to
the horses name along with the SP of that run.
G The horse's
gender
DSR The number of
days since the horse last ran.
DNR The number of
days to the horse's next run ( where this information is
available).
Hgr Which type of
headgear ( if any ) the horse is wearing in today's race.
Age The horses
age.
Jockey The
Jockey's name.
All The amount in
pounds (Lbs) that the (not fully experienced) jockey can 'claim' -
i.e the amount of weight the horse has to carry is reduced by the
jockeys claim amount.
Trainer The
Trainer's name. Numbers in brackets are the number of entries in
this race ( where there is more than one ).
Wt The amount of
weight the horse is due to carry (less any jockey 'claim' - see
above).
OR The horse's
Official Handicap Rating - the horse's ability rating as deemed by
the Jockey Club.
Ng Our first
Neural Rating is compiled by feeding over 20 years worth of
complex horse racing data through a sophisticated Neural Net and
then applying the result to today's race details.
Nx Watch any
television program about horse racing or read the racing press and
you will see that experts often disagree on who will win a
particular race. With this in mind this second Neural Figure sees
the same 20 years of data fed through a different Neural Net and
then as before applied to today's race.
Please note that the highest rated
horses under Ng & Nx are colour-coded in Yellow, whilst the
second-highest rated horses are coloured-coded in Light Yellow.
SF2 The second
best Speed Figure a horse has obtained in the previous 12 months.
SF1 The best Speed
Figure a horse has obtained in the previous 12 months.
Please note that the highest rated
horses under Ng & Nx are colour-coded in Yellow, whilst the
second-highest rated horses are coloured-coded in Light Yellow.
Favourite Percentages
The strike rate of the favourite in the equivalent type of race
over the last five years.
Last Years Winner
The Winner of this race last year ( where there was an equivalent
race ).
Summary Box Selections
This is a summary of all the Top Rated selections that are
highlighted by our main ratings in the SUMMARY BOX. In this list
it is then brought down to single selections to try and point to
the likely contenders in a given race. In the table above you can
see that three horse in particular are highlited more than once
and the number of times they are highlighted is shown next to
their name in brackets. No figure in brackets next to the name
means they have only been mentioned once.
In the example above you can see
FONTERUTOLI has Six Mentions [6] , OLIVERS MOUNT has Three
Mentions [3] and NUBAR BOY has Two Mentions [2] leading you to the
conclusion that in this case these three horses may be the likely
contenders in this race.
The final result sees NUBAR BOY
oblige at 10/1 with OLIVERS MOUNT coming 3rd at 9/4.
It may potentially pay dividends to
follow selections that are showing a figure in brackets of [9] or
above which during testing were winning at a range of prices and
showing a strike rate of around 50%.

SUMMARY BOX
During our many years of business
we have long been aware that not only do we have Professional
Members who use our ratings to build up an overall picture and for
full blown form study but we also have members who for one reason
or another do not use our long standing service to the fullest
extent possible. This can of course happen for a whole variety of
different reasons but both professional and amateur all have one
thing in common i.e. they need our information to be presented in
an easy to read format.
The Summary Box does exactly that and it is quickly clear
which horse or horses our Top Rated are telling you may
potentially be in with a chance in todays race.
In the
example above we can very quickly see that MAGIC SKYLINE is
highlighted ( Top Rated ) no less than NINE TIMES.
Unsurprisingly MAGIC SKYLINE obliges at 15/8 winning by no less
than 14 Lengths !!
It may potentially pay dividends to
follow selections that are highlighted NINE TIMES or more and
there is no need for you to count this figure in the Summary Box
as you will also find the full list of Horses repeated and
summarised on the RACECARD in the Summary Box Selections.
During testing Summary Box selections highlighted [9] times or
more were winning at a range of prices and showing a strike rate
of around 50%.

RACECARD COLOUR HIGHLIGHTING
Below the racecards you will see
much more detailed Jockey and Trainer information in table form.
To help bring this information into an easy to read format our
racecards feature colour coding to show Hot Jockeys ( Pink ), Hot
Trainers ( Salmon ) and 10 Day Trainer Form ( Green on Racecard
Numbers ). To qualify as a HOT a Jockey or Trainer has to be in
Profit in the corresponding table.

TRENDS FOR COURSE DISTANCE GOING
AND CLASS
Trends for the COURSE, DISTANCE,
GOING and CLASS of the race under anaysis all brought together and
then displayed in one easy to read table. You are able to see
instantly how each horse has run previously in each category
making this ideal for finding horses to WIN, PLACE or even LAY.
This single table alone is extremely powerful and it would take
you many hours of form study using traditional means to pull all
this data together for a single race, let alone for multiple races
at multiple meetings.

DRAW ADVANTAGE
Taken from our massive database of
information all the races of the same number of runners and same
distances are analysed to find the draw trends for each individual
race. This then accurately shows us the exact strike rates from
each range of stall numbers.

LATEST SPEED FIGURES
Here we can see the Speed Figures
for each of the horses five previous runs displayed side by side
in chronological order. We can then also see the SF2 and SF1 Speed
Figures as displayed on our racecards. All this information
together allows you to very easily make comparisons on whether a
horse may potentially be improving or declining over time.
SF2 The second
best Speed Figure a horse has obtained in the previous 12 months.
SF1 The best Speed
Figure a horse has obtained in the previous 12 months.
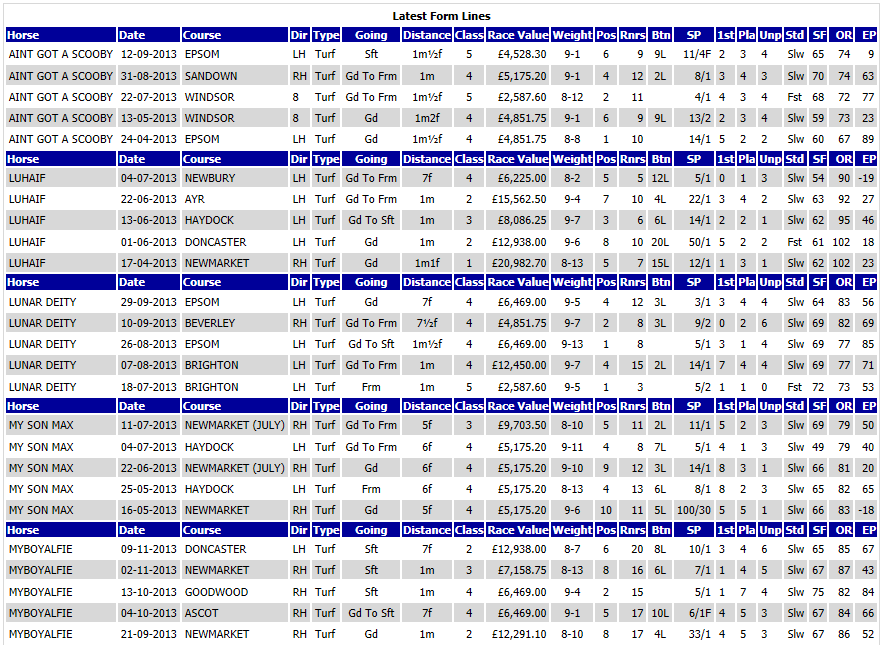
LATEST FORM LINES
This table allows all aspects of a
horses form to be viewed in one very easy to read table. The form
is then also tied in with its Speed Figure, Official Rating and
our unique EP Ratings making finding those with a real chance in
any given race very easy indeed.
Horse The horses
racing name as displayed on the racecard.
Date The date of
the race under analysis.
Course The
racecourse where the race took place.
Dir The
direction of this racecourse i.e. Left, Right or Figure
Of 8
Type The type of
race i.e. whether it was Turf, All Weather or National Hunt
Racing.
Going The official
going for the race.
Distance The
distance of the race.
Class The Class of
the race.
Race Value The
Prize Money won by the race winner.
Weight The weight
the horse carried in the race.
Pos The finishing
position of horse in the race.
Runners The number
of runners in the race.
Btn The distance
beaten where the horse did not win.
SP The Starting
Price of the horse.
1st How
many horses in this particular race have Won their races
since the date of this race.
Pla How
many horses in this particular race have been Placed in
their races since the date of this race.
Unp How
many horses in this particular race have remained
unplaced in their races since the date of this race.
Std Is
the race Winners time Faster or Slower than Standard
Time.
SF The RaceXpert
Speed Figure for this run.
OR The horses
Official Raing as awarded by the Official Handicapper.
EP The EP Rating
awarded by RaceXpert for this run.

THE KNOWLEDGE
Probably one of RaceXperts most
popular features ever this piece of super analysis leaves no stone
unturned when it comes to Winner Finding Pointers. The runners are
sorted by SF AVG4 (An average of the horses last four speed
figures) and here is an explanation of each piece of information
displayed.
Horse - The Racing Name Of The
Horse
CLS ( Class ) up in class or down
in class, by how many classes or at the same level as todays race
DST ( Distance ) up in distance or
down in distance, by how many furlongs or at the same distance as
todays race
CLS - W Number of Wins in this
class
CLS - R Number of Runs in this
class
CLS - % Number of Wins in this
class expressed as a percentage
DST - W Number of Wins at this
distance
DST - R Number of Runs at this
distance
DST - % Number of Wins at this
distance expressed as a percentage
GNG - W Number of Wins on this
going
GNG - R Number of Runs on this
going
GNG - % Number of Wins on this
going expressed as a percentage
MTH - W Number of Wins this month
MTH - R Number of Runs this month
MTH - % Number of Wins this month
expressed as a percentage
SF Best - Highest Speed Figure
recorded in the last two years
SF RC - Second Highest Speed Figure
in the last 12 months
SF 1 LTO - Speed Figure Last Time
Out
SF 2 LTO - Speed Figure Second Last
Time Out
SF 3 LTO - Speed Figure Third Last
Time Out
SF AVG 4 - An average of the horses
last four speed figures

EP RATINGS
Originally featured in the software
version of RaceXpert as a rating calculated on the horses last run
it was always the intention of the creator of Expectancy against
Performance ratings to have the horses last three runs available.
We have now done this and then taken these superb ratings a step
further by providing an Average of the last three EP ratings plus
a further column called AVG + which is then used to sort the
order. The actual EP calculation is derived from our own secret
formula, developed over a considerable amount of time, and it
takes into account many factors. Everything is then pulled
together, quantified, displayed and ranked.
EP 3 LTO - EP Figure Recorded 3
Runs Ago
EP 2 LTO - EP Figure Recorded 2
Runs Ago
EP 1 LTO - EP Figure Recorded 1
Runs Ago
EP AVG 3 - An average of the last
three EP figures
Best of 3 - The highest EP
rating in the last three runs
EP AVG + - The highest EP rating of
the last three runs added to the average of the last three
ratings.

EP FORM
On nearly every form study tool
there is you will find Jockey and Trainers stats displayed in
exactly the same way and indeed we also display them in this
traditional manner in our original Jockey and Trainer Form tables.
There is however a long standing issue with this as we will now
explain for you.
First of all let's take an imaginary
Jockey called “George Kingston” to use in our explanation.
In two weeks time “George Kingston” is likely to be crowned
champion Flat jockey of the year. Throughout the year he would
have won more races than any other jockey. But is it fair to say
“George Kingston” is the best jockey purely because of the number
of winners he has had?
Surely the number of winners he has
had is proportional to the number of races he has ridden in. The
more rides he has, the more likely he is to have more winners.
A far better method to determine who is the best is to look at
the strike rate.
Looking at the current strike rate table
reveals “George Kingston” is indeed the best jockey. He currently
tops the table based purely on strike rate with other Jockeys this
year close behind him.
But again, is it fair to determine
who is the best purely on strike rate? The best jockeys are most
likely to be riding the best horses. They will ride more
favourites whilst lesser known jockeys will be riding outsiders
with little chance of winning.
The best way to rank
jockeys is to determine which jockeys are producing more winners
than expected ( which we call EP FORM ).
If we divide the
number of actual winners a jockey has achieved by the number of
expected winners, we can produce an index which shows who really
is the better jockey.
The expected number of winners is
derived from the price of the horse. Evens shots win about 50% of
the time. So if a jockey rode ten evens shots, we would expect him
to win five races. If a jockey rode ten 9-1 shots, we would expect
him to win one race.
In our JOCKEY & TRAINER EP FORM
tables we have taken a time period of 5 years and looked at the
last 50 rides. We have done this for JOCKEYS, TRAINERS and JOCKEY
& TRAINER combinations for ALL CODE SPECIFIC rides. Code specific
means FLAT, NH or ALL WEATHER individually.
This
information you will see displayed in the first three EP FORM
tables features all of the past CODE SPECIFIC runs ( using the
filter above ) of participants taking part todays race.
In
the second three EP FORM tables you will then see the same
information but now only for the COURSE of todays race under
analysis i.e. you do not have to trawl through reams and
reams of stats to find the information applicable to just this
individual RACE and COURSE.
All of these six tables are
sorted by their EP VALUE, which means that Jockeys or Trainers
currently performing better than expected will be at the top of
the table and usually showing a positive value.
Jockeys or
Trainers not currently performing as well are at the bottom of the
tables and will also ( although not always ) often be seen with
minus EP Values.
We have also carried out a PROFIT or LOSS
calculation in each case based on backing all the runners at SP (
Starting Price ).
Regardless of how they are analysed
Jockey and Trainer Stats can never be taken as an absolute measure
in complete isolation i.e. you need to also factor in the horse !!
But having said that you will still find those rated at the top of
these tables winning much more than those at the bottom, making
this extremely valuable information to both BACKERS and LAYERS
alike.

BEST
The BEST SPEED FIGURE as featured
in THE KNOWLEDGE table is the highest speed figure recorded by a
horse in the last two years. Although higher figures may have been
recorded over longer time spans we have found the last two years
to be the most relevant. It is not unusual to see these horses
suddenly go in at big prices and this unique table allows you to
analyse in great detail all aspects of class and official rating
at a single glance.
Horse - Horse Name
Date - Date Best Speed Figure
Achieved
CLS - Class Of Race Best Figure
Achieved In
OR - OR Rating When Best Figure
Achieved
OR Today - Today's Official Rating
SF Best - Best Speed Figure
OR +-= - Plus or Minus ( number )
OR Rating is from Best Figure Race To Today's Race
CLS +-= - Plus or Minus ( number )
of race Classes from Best Figure Race To Today's Race

QUICKFORM
Although you will find a huge
number of Winners will come from the Top Four Horses in this table
here you can see how QUICKFORM helps to point you in the direction
of other possibilities. Showing the highest Speed Figure at this
Course and with the most suitability GREEN BOXES, a particular
horse is being flagged up here as a potential race Winner. The
result is that on this occasion FOXY MUSIC wins at a very tasty
14/1.
Horse - Horse Name
When the horse name is coloured green this directly references the
TEN DAY TRAINER FORM table further down which shows Trainers who
over the last ten days are currently in Profit when backing all
their runners at SP.
Jf Colouring in
this column references the TEN DAY JOCKEY FORM table further down
and shows Jockeys who over the last ten days are in Profit when
backing all their mounts at this course at SP.
Tf Colouring in
this column references the TEN DAY TRAINER FORM table further down
and shows Trainers who over the last ten days are in Profit when
backing all their runners at this course at SP.
Age The age of the
horse as displayed on the racecard.
The next six sections of QUICKFORM
reference the horses SUITABILITY for todays race conditions. You
will notice that each horse either has a Green Box or a Red Box
with two numbers in it. Green shows suitability and Red
unsuitability based on its past runs.
The two numbers in each box show
how many times the horse has achieved ( if in a Green Box ), or
failed to achieve ( if in a Red Box ) a WIN or PLACE in its last
24 months of code specific runs. So for example 2/8 in a Green Box
in the Co Win Column would be 2 Wins out of the last 8 code
specific runs at todays course, 0/8 in a Red Box in the Co Win
Column would mean that the horse has run 8 times but has never Won
at todays course.
Be aware that 24 months is the
maximum amount of time used to make these calculations as past
testing has shown this to be the optimum time span. You will also
note that some horses have run more often than others. For a more
detailed breakdown of the previous 24 months of code specific runs
please check the TREND TABLE further down.
Co Win The horse
has won ( or not ) at todays COURSE.
Co Pla The horse
has been placed ( or not ) at todays COURSE.
Di Win The horse
has won ( or not ) at todays race DISTANCE.
Co Win The horse
has been placed ( or not ) at todays DISTANCE.
Go Win The horse
has won ( or not ) on todays GOING.
Go Pla The horse
has been placed ( or not ) on todays GOING.
Trend This is the
placing of the horse in the TREND TABLE. In the TREND TABLE we
have taken into account information such as Course, Distance,
Going and Class and then used a unique proven formula to rate the
horses in order of their expected race trend. When this is tied
together with the SUITABILITY you have an extremely powerful
crosscheck facility.
Best Speed Figure
These four columns show the BEST SPEED FIGURE that each horse has
achieved in a given set of race conditions.
Co The horses best
Speed Figure recorded at this COURSE.
Di The horses best
Speed Figure recorded at this DISTANCE.
Go The horses best
Speed Figure recorded on this GOING.
Cl The horses best
Speed Figure recorded in this CLASS of race.
Tot Rns - This
column shows the number of code specific runs this horse has run
in the last 24 months and has been used to calculate the Rate %
columns.
Rate % These two
columns show the horses trend for both Winning and / or Being
Placed based on all of its code specific runs for the last 24
months which is then expressed as a percentage. After extensive
testing we also decided to use the PLACE PERCENTAGE as the default
sorting for the whole of the QUICKFORM table and you will find an
amazing amount of winners and forecasts will come from the top few
horses !!
Highest Class Win
This section of QUICKFORM provides you with a detailed breakdown
of a Horses Highest Class Win which then enables you to accurately
rate just how good a particular horse is.
Date The date of
this horses Highest Class Win
SpF The Speed
Figure this horse recorded when achieving its Highest Class Win
Cl The Class of
the Highest Class Win
Clv The difference
between the horses Highest Class Win and the Class of todays race
OR The horses
Official Rating ( OR ) when it recorded its Highest Class Win
ORv The difference
between the OR of the Highest Class Win and the OR in todays race
Pm AbRa It is
generally accepted that the amount of Win Prize Money a horse has
won is an accurate measure of a horses ability. Our Prize Money
ABILITY RATING takes into account a horses Win Prize Money for the
last two years i.e. a high figure means it has won a large amount
of Prize Money.

HANDICAP REPORT
First column - The horse's name
Second column - Today's OR (
Official Rating )
Third column - The difference
between the last run OR and today's OR
Fourth column - The difference
between the OR of the horse's latest win and today's OR
Next follows up to a maximum of 8
handicap runs within the last two years, code specific with the
latest run is on the left. Each run shows the OR for the run and
the distance beaten.
Handicap Screen Colouring
GREEN - The horse ran in a higher
class than the class of today's race
ORANGE - The horse ran in the same
class as the class of todays race
RED - The horse ran in a lower
class than the class of today's race
YELLOW - The horse won that run
Note : In the case of
Irish Racing where Class Information is not genereally
available we make an approximation of the likely Race
Class before making any other Class based calculations.
There are a multitude of different
ways to use the Handicap Report. Below is an example which may
give you some thoughts on how to develop your own. During testing
on a completely random day it resulted in four selections giving
an 11-1 winner, 11-1 and 7-1 thirds and one unplaced. In the
example race above SAM NOMBULIST was the only qualifier on another
day and it duly obliged at a very nice 8-1 !!
Rules - 3yo+ Flat(Turf and All
Weather) Handicaps
1. Consider only runs that are
coloured green.
2. Starting with the latest run and
working across the screen - the first column of runs on the left
of the screen - stop at the first column that has either a "green
yellow win" or a green beaten by no more than 1 length run.
3. If only one that is the
selection. If more than one take the horse that has the best
difference between the OR for the run and today's OR.
Just to re-iterate again that the
method above is given PURELY AS AN EXAMPLE of how the information
provided in this report may potentially be utilised.

MASTER FORM SPEED
Column
1. Racecard Number same as the
first column on the Racecard screen
2. Racing name of the horse
3. Age of the horse
4. Gender of the horse
5. Highest speed figure of the
horses last three runs
6. Faster than Class RaceXperts own
winning speed pars reflected in Faster than Class figures for each
class of race. A plus figure indicates a performance from one of
the horses last three runs that is faster than the speed par for
todays class.
7. Formspeed A unique feature only
available in RaceXpert . The figures represent improvement or
decline in horses relevant to each other, and not in isolation.
These figures need to looked at in conjunction with a horses
highest winning class race.
8. Class Speed the highest speed in
the highest class where the horse won or was placed second or
third.
9. Class of highest win the actual
class is shown
10. Well In The Well In at the
weights is a measure of how favourably or otherwise a horse is
being treated by the Official Handicappers. Again the formula used
to produce these figures is exclusive to RaceXpert A plus figure
indicates the horse is favourably treated at the weights and,
conversely, a minus figure means the horse is not well treated by
the Official Handicappers.
COMMON SENSE WARNING
There are many horse racing rating
services that will imply that blindly backing their particular top
rated horses will make you a profit. This simply is NOT TRUE and
we would NEVER advise anyone to blindly back top rated horses
regardless of the data supplier being used. Take your time and
carefully assess ALL of the information being supplied and then
make a sensible judgement call based on past experience, study of
the many excellent books on the topic of horse racing and the
knowledge that our ratings will help to point you in the right
direction.
If horses were machines, then
ratings alone could be accepted at near face value. But race
horses are not machines; they are animal athletes whose
performances in many instances are governed by stable intentions
as well as the physical condition of the horse. You will therefore
never be able to get it right every time. However what you will do
with the help of RaceXpert is build a picture of the race under
analysis and by putting the odds in your favour reap the potential
long term benefits.
With Speed Figure winners at 100/1
and 66/1 and members telling us of 2600/1 successful forecast we
know that our ratings are unquestionably the best in the market
place. This is also why we have been successfully providing
ratings since 2002. Members also occasionally let us know what
about RaceXpert based methods that are working well for them which
we then share with fellow RaceXpert Members.
|